Credit to NumbersUSA.com – October 8, 2023
There are two ways to think about illegal immigration numbers:
1) the number trying to enter illegally; and
2) the number entering illegally.
The best metric to gauge the former is the “encounter“. August 2023 encounters were the highest in history at over 300,000; the September numbers are expected to be even worse when they are made public.
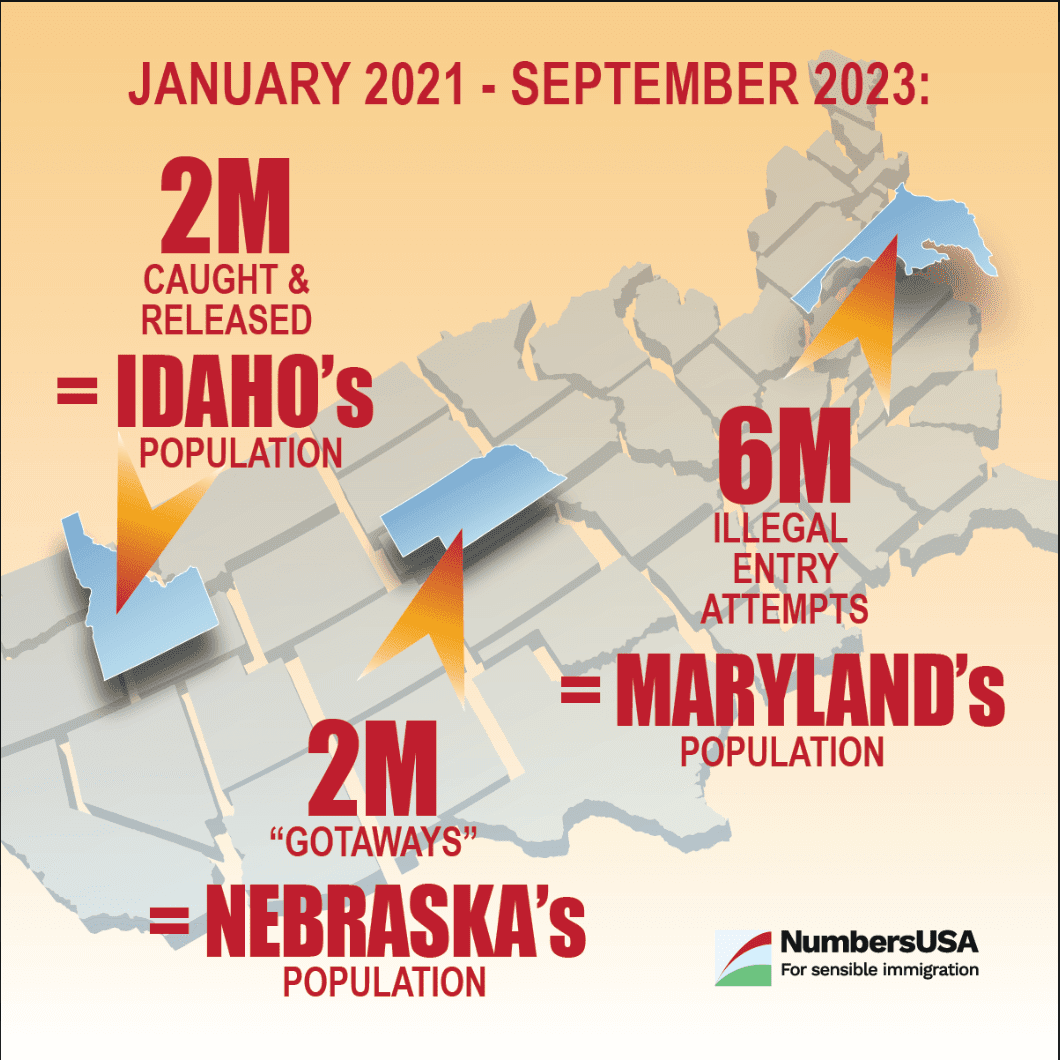
To measure the number of people who enter illegally, you have to add up catch-and-release numbers and so-called “gotaways”. The precise numbers are either not known or not made public by the government, but since January, 2021, an estimated 4 million people – roughly the population of the city of Los Angeles – have bypassed the legal immigration system established by Congress.
To get the full sense of illegal immigration’s impact on the interior, you then have to add in visa overstays (which hit a record high in 2022). That gives you an estimated 5.7 million – or roughly the combined populations of Los Angeles, Chicago, and Dallas – since 2021.
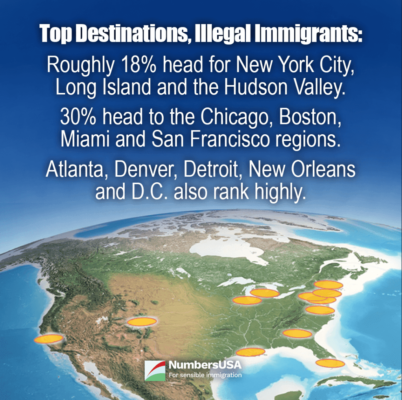
Cities under strain.
The federal government hasn’t made all of the relevant data public, but – using analysis of a group of 2,5000 migrants who are tracked due to a federal court ruling – we can get a good idea of which U.S. cities are most impacted.

Better immigration is possible.
It shouldn’t be hard to do better than “worst in history.” The only obstacle to securing a better policy is political will.
H.R. 2 passed the House in the Spring. The bill includes reforms that have had bipartisan support in the past including closing loopholes and mandating E-Verify. The Senate should pass the bill and send it to the White House for the president’s signature.
In absence of these necessary reforms, the crisis will continue to be felt on both sides of the border.


